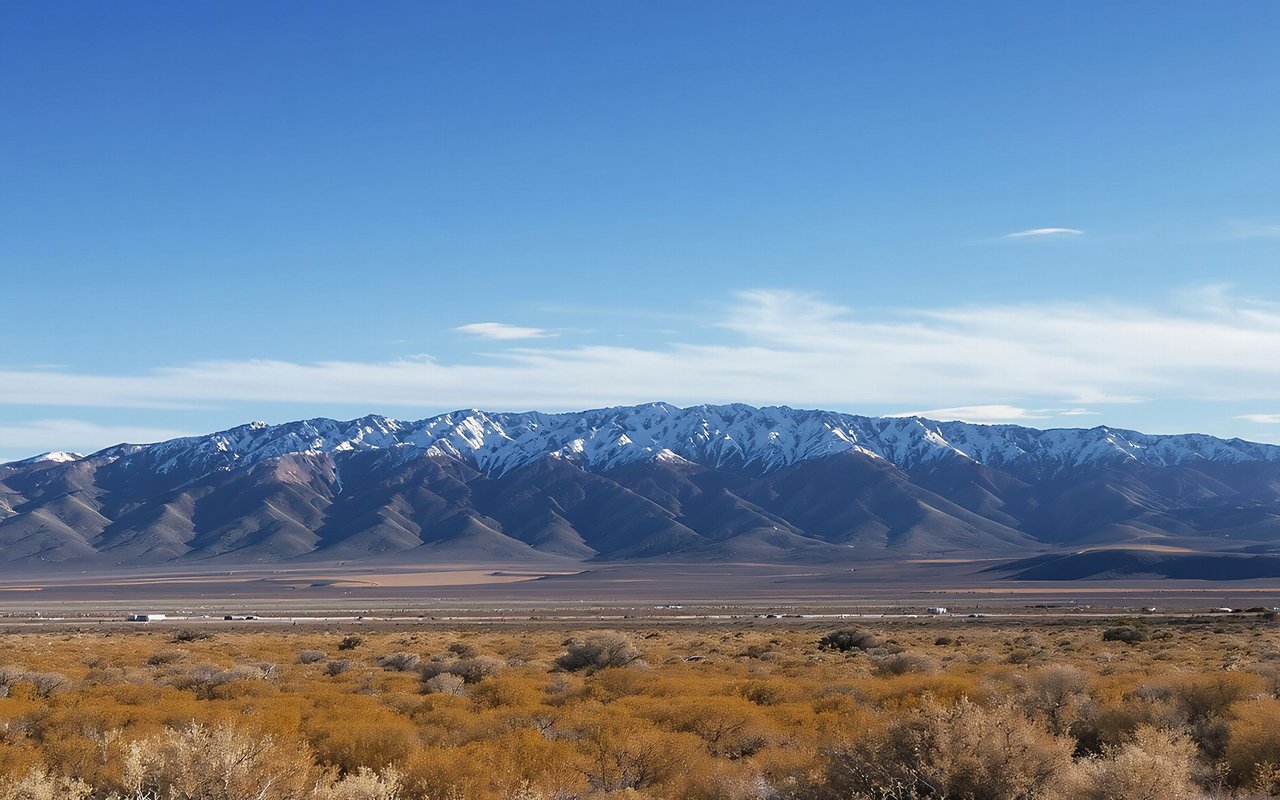
Logandale offers a charming small-town atmosphere with stunning desert landscapes and a close-knit community. Residents enjoy outdoor activities such as hiking and biking, with easy access to nearby parks and recreational areas. The area boasts a rich cultural heritage, highlighted by local events and festivals that bring neighbors together. With its peaceful environment and friendly vibe, Logandale is perfect for families and individuals seeking a serene lifestyle away from the hustle and bustle.
3,543 people live in Logandale, where the median age is 30 and the average individual income is $33,255. Data provided by the U.S. Census Bureau.
Total Population
Median Age
Population Density Population Density This is the number of people per square mile in a neighborhood.
Average individual Income
There's plenty to do around Logandale, including shopping, dining, nightlife, parks, and more. Data provided by Walk Score and Yelp.
Explore popular things to do in the area, including Gordas Tacos, Pomegranate Art Festival, and Pirates Landing.
| Name | Category | Distance | Reviews |
Ratings by
Yelp
|
|---|---|---|---|---|
| Dining | 0 miles | 1 review | 5/5 stars | |
| Dining | 1.62 miles | 0 reviews | 0/5 stars | |
| Dining · $$ | 2.5 miles | 65 reviews | 4.3/5 stars | |
| Dining | 2.6 miles | 0 reviews | 0/5 stars | |
| Active | 0.9 miles | 4 reviews | 4.5/5 stars | |
| Active | 2.29 miles | 3 reviews | 5/5 stars | |
| Beauty | 0 miles | 0 reviews | 0/5 stars | |
|
|
||||
|
|
||||
|
|
||||
|
|
||||
|
|
||||
|
|
Logandale has 936 households, with an average household size of 3.79. Data provided by the U.S. Census Bureau. Here’s what the people living in Logandale do for work — and how long it takes them to get there. Data provided by the U.S. Census Bureau. 3,543 people call Logandale home. The population density is 69 and the largest age group is Data provided by the U.S. Census Bureau.
Total Population
Population Density Population Density This is the number of people per square mile in a neighborhood.
Median Age
Men vs Women
Population by Age Group
0-9 Years
10-17 Years
18-24 Years
25-64 Years
65-74 Years
75+ Years
Education Level
Total Households
Average Household Size
Average individual Income
Households with Children
With Children:
Without Children:
Marital Status
Blue vs White Collar Workers
Blue Collar:
White Collar: